import sys
import pygame


def gray_scale(img):
    for y in range(image.get_height()):
        for x in range(image.get_width()):
            r, g, b, a = image.get_at((x, y))
            c = ((0.299 * r) + (0.587 * g) + (0.114 * b))
            image.set_at((x, y), (c, c, c))


argc = len(sys.argv)
img_in = sys.argv[1]
img_out = sys.argv[2]

pygame.init()

image = pygame.image.load(img_in)
w = image.get_width()
h = image.get_height()
display_surface = pygame.display.set_mode((w, h))

gray_scale(image)

pygame.image.save(image, img_out)

pygame.display.set_caption(img_in + ' -> ' + img_out)

finish = False
while not finish:
    display_surface.blit(image, (0, 0))
    for event in pygame.event.get():
        if event.type == pygame.QUIT:
            finish = True
        elif event.type == pygame.KEYDOWN:
            if event.key == pygame.K_ESCAPE:
                finish = True
        pygame.display.update()
pygame.quit()
quit()
import sys
import pygame


def line_art(image, surface, limiar):
    surface.fill((255, 255, 255))
    for y in range(image.get_height()):
        for x in range(image.get_width()):
            # primeiro calculamos o tom de cinza do pixel
            r, g, b, a = image.get_at((x, y))
            c = ((0.299 * r) + (0.587 * g) + (0.114 * b))
            # e depois separamos pelo limiar
            if c < limiar:
                c = 0  # se menor que o limiar, fica preto
            else:
                c = 255  # se maior, fica branco
            surface.set_at((x, y), (c, c, c))


argc = len(sys.argv)
img_in = sys.argv[1]
img_out = sys.argv[2]
limiar = 100

if len(sys.argv) == 4:
    limiar = int(sys.argv[3])

pygame.init()

image = pygame.image.load(img_in)
w = image.get_width()
h = image.get_height()
surface = pygame.display.set_mode((w, h))

line_art(image, surface, limiar)

pygame.display.set_caption(
    img_in + ' -> ' + img_out + ' limiar: ' + str(limiar))

finish = False
pygame.key.set_repeat(1)
while not finish:
    for event in pygame.event.get():
        keypressed = False
        if event.type == pygame.QUIT:
            finish = True
        elif event.type == pygame.KEYDOWN:
            # Vamos as teclas para mudar o limiar em
            # tempo de execução. Seta para cima aumenta
            # o limiar e seta para baixo diminui
            if event.key == pygame.K_ESCAPE:
                finish = True
            if event.key == pygame.K_UP:
                limiar += 1
                keypressed = True
                if limiar > 255:
                    limiar = 255
            if event.key == pygame.K_DOWN:
                limiar -= 1
                keypressed = True
                if limiar < 0:
                    limiar = 0
        if keypressed:
            print('limar:', limiar)
            line_art(image, surface, limiar)
        pygame.display.update()

pygame.image.save(surface, img_out)

pygame.quit()
quit()
import sys
import pygame


def gray_scale(img):
    for y in range(image.get_height()):
        for x in range(image.get_width()):
            r, g, b, a = image.get_at((x, y))
            c = ((0.299 * r) + (0.587 * g) + (0.114 * b))
            image.set_at((x, y), (c, c, c))

'''
Matrixes de convolução do algoritmo de Roberts para detecção
de bordas

GX = | +1  0 |
     |  0 -1 |

GY = |  0 +1 |
     | -1  0 |
'''


def roberts(img):
    for y in range(h-1):
        for x in range(w-1):
            a, _, _, _ = image.get_at((x, y))
            b, _, _, _ = image.get_at((x+1, y))
            c, _, _, _ = image.get_at((x, y+1))
            d, _, _, _ = image.get_at((x+1, y+1))

            gx = d - a
            gy = b - c
            g = abs(abs(gx) + abs(gy))
            if g > 255:
                g = 255
            image.set_at((x, y), (g, g, g))


argc = len(sys.argv)
img_in = sys.argv[1]
img_out = sys.argv[2]

pygame.init()
white = (255, 255, 255)
image = pygame.image.load(img_in)
w = image.get_width()
h = image.get_height()
display_surface = pygame.display.set_mode((w, h))

gray_scale(image)   # Primeiro deixamos em tons de cinza
roberts(image)      # Depois detectamos as bordas usando Roberts

pygame.image.save(image, img_out)

pygame.display.set_caption("Roberts - " + img_out)

finish = False
while not finish:
    for event in pygame.event.get():
        if event.type == pygame.QUIT:
            finish = True
        elif event.type == pygame.KEYDOWN:
            if event.key == pygame.K_ESCAPE:
                finish = True
    display_surface.blit(image, (0, 0))
    pygame.display.update()
pygame.quit()
quit()
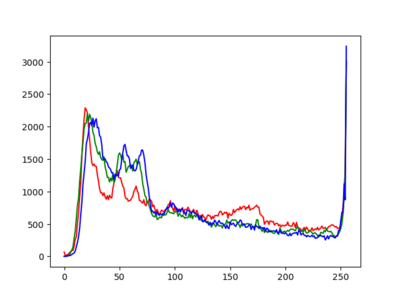
O histograma de uma imagem é simplesmente um conjunto de números indicando o percentual de pixels naquela imagem que apresentam um determinado nível de cinza. Estes valores são normalmente representados por um gráfico de barras que fornece para cada nível de cinza o número (ou o percentual) de pixels correspondentes na imagem. Através da visualização do histograma de uma imagem obtemos uma indicação de sua qualidade quanto ao nível de contraste e quanto ao seu brilho médio (se a imagem é predominantemente clara ou escura).
import sys
import pygame
import matplotlib.pyplot as plt

pygame.init()

filename = sys.argv[1]
image = pygame.image.load(filename)

hist_x = []
hist_y = []
for i in range(256):
    hist_x.append(i)
    hist_y.append(0)

for y in range(image.get_height()):
    for x in range(image.get_width()):
        r, g, b, a = image.get_at((x, y))
        gray = int((0.299 * r) + (0.587 * g) + (0.114 * b))
        hist_y[gray] += 1

plt.plot(hist_x, hist_y)
plt.show()

pygame.quit()
quit()
import sys
import pygame
import matplotlib.pyplot as plt

pygame.init()

filename = sys.argv[1]
image = pygame.image.load(filename)

hist_x = []
hist_yr = []
hist_yg = []
hist_yb = []
for i in range(256):
    hist_x.append(i)
    hist_yr.append(0)
    hist_yg.append(0)
    hist_yb.append(0)

for y in range(image.get_height()):
    for x in range(image.get_width()):
        r, g, b, a = image.get_at((x, y))
        hist_yr[r] += 1
        hist_yg[g] += 1
        hist_yb[b] += 1

plt.plot(hist_x, hist_yr, color="red")
plt.plot(hist_x, hist_yg, color="green")
plt.plot(hist_x, hist_yb, color="blue")
plt.show()

pygame.quit()
quit()


